
I thought people might be interested in some updates on the VAX LOT data in VAERS. I recently received some manufacturing and expiration date data with regards to the three COVID-19 injectable products being pumped into Americans for the past year. I am still waiting for Janet and Rochelle to get back about the VAX_LOT nomenclatures and other data on how many doses comprise each VAX_LOT, etc… (hardy har har), but in the meantime, while I wait for hell to freeze over, this manufacturing and expiration date data can be put to use, thanks to Craig. Also in this meantime, I will explain why the idea that 5% of VAX LOTs are responsible for 100% of deaths is not correct. This does not mean that some VAX LOTs are not responsible for more Severe Adverse Events, it just means that the distribution of the contribution per VAX LOT is not being reported accurately.
 The first thing I did when I got this new date data for the VAX LOTs was append the new data onto my existing VAERS data set using VAX LOT as a common variable. What this accomplished, besides combining the data sets, was to majorly clean up the VAX LOT column entries in the VAERS set and seemingly, mostly at the expense of all of the non-sensical and mis-entered VAX LOT data. Excellent! The only pending issue is the as yet unidentified VAX LOTs that got left behind in the appending process: it is possible that those lots are very important. It is even possible that the list of VAX LOTs in the new data set are the ‘active’ LOTs and therefore, the ones that got dropped, may represent the ‘inactive’ ones – aka: Saline. Just an idea. But likely any Saline lots would never end up in VAERS. But it is possible. I have no way to verify if this new VAX LOT list is remotely complete.The data loss after merging the sets went like this: approximately 49% of the data for Pfizer, 47% for Moderna and 46% for Janssen. That’s brutal but I can live with it considering the absolute counts are so large so start with. With the fresh and clean merged by VAX LOT data set with the new manufacturing and expiration date columns, we can do some calculatin’ and funduggery.
The total numbers of adverse events following the data merge is 155,942, 166,924and 32,828 for Pfizer, Moderna and Janssen products, respectively.
The total numbers of death adverse event reports following the data merge is 2,975, 2,585 and 556 for Pfizer, Moderna and Janssen products, respectively.
So I would like to address the 5% claim thing using the new clean data set. (I have also addressed this with the original VAERS data set.) If you look for information online relating to the claim that “100% of Covid-19 Vaccine Deaths were caused by just 5% of the batches produced according to official Government data”, you will find it easily. However, this claim is false. Here’s how and why.
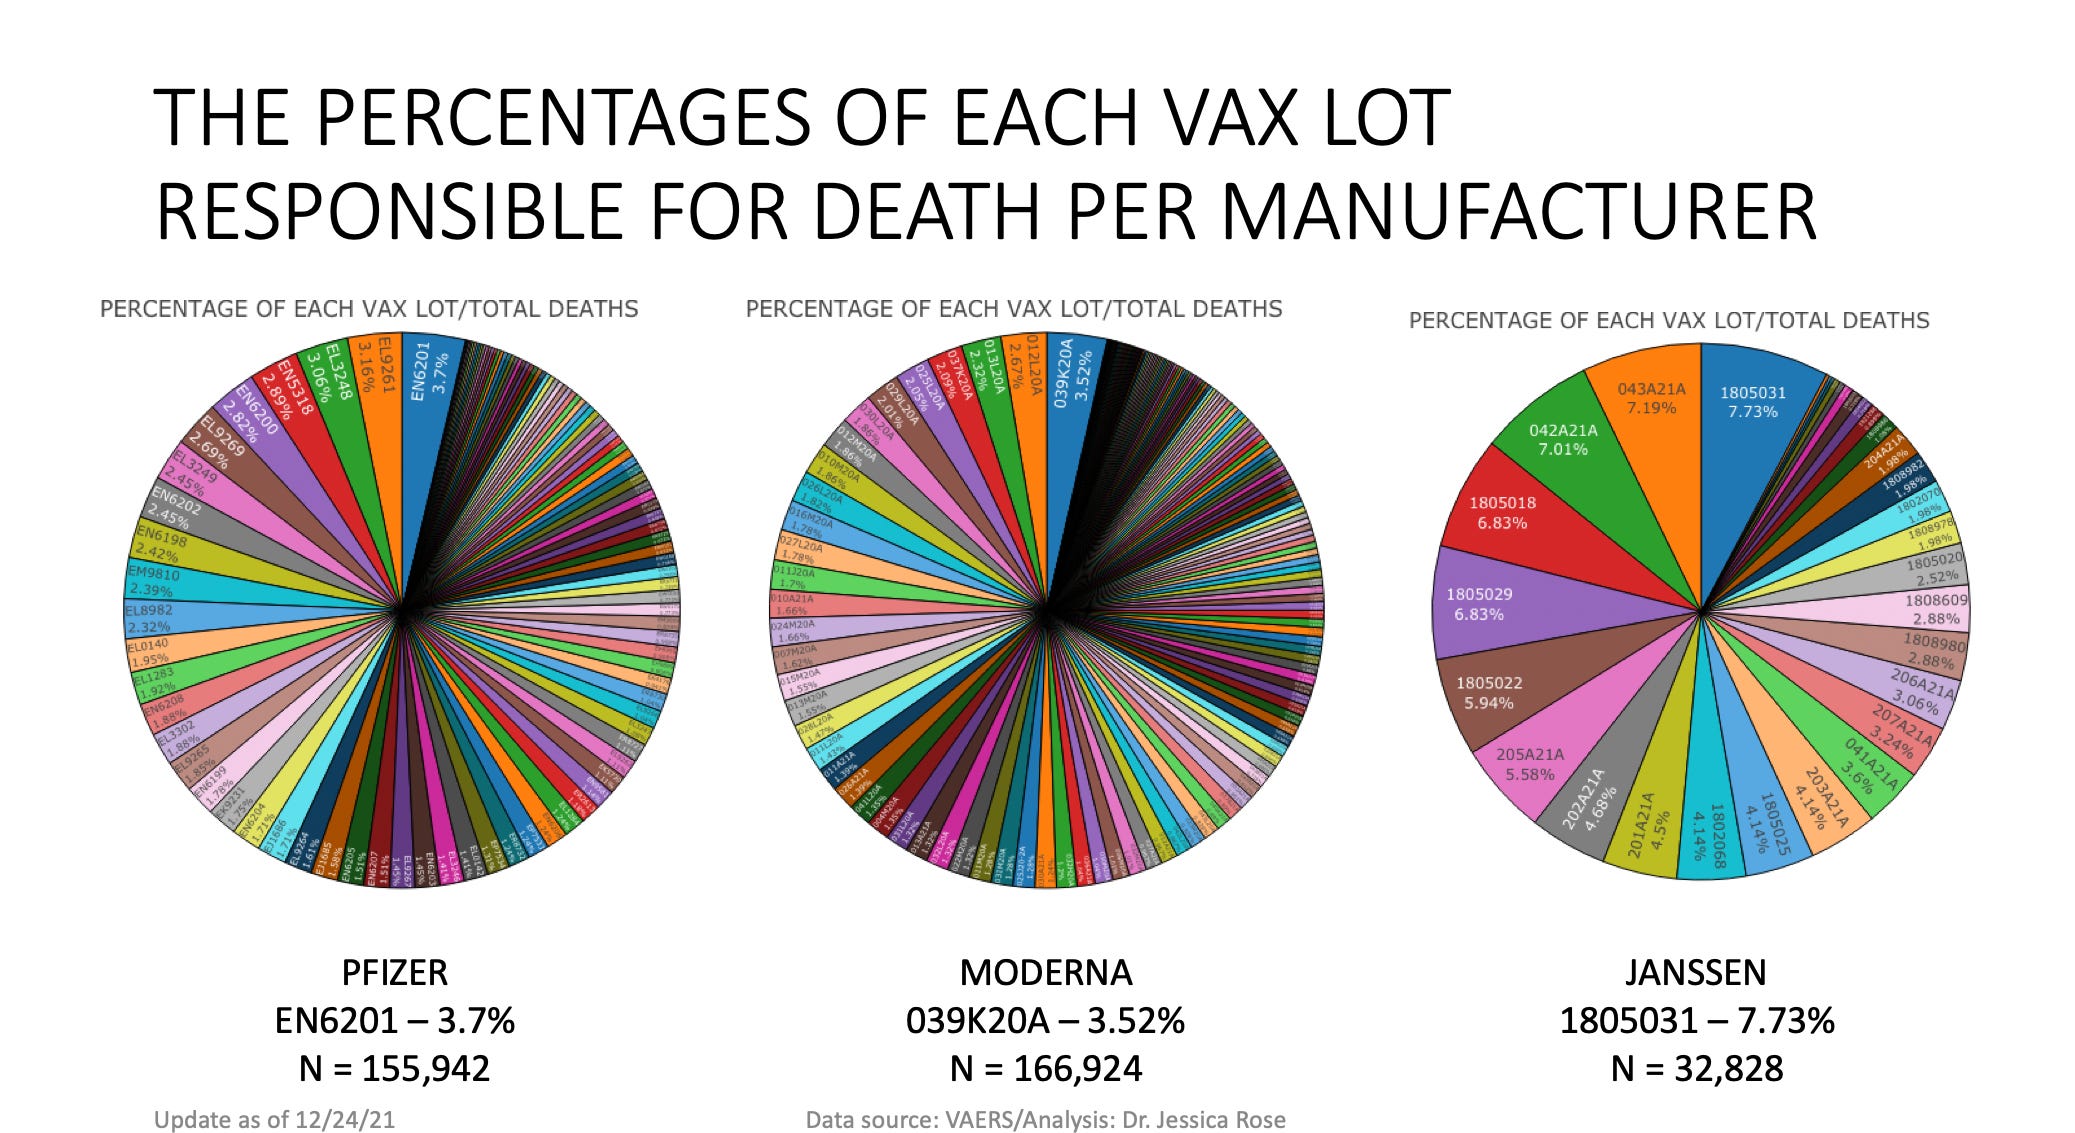
The distribution of the percentage of deaths reported to VAERS is relatively uniform among VAX LOTs, irrespective of manufacturer, as can be seen in the pie chart figure below. Pfizer is on the left, Moderna in the center and Janssen on the right. But, this observation could be deceiving our eyes. Notice how many VAX LOTs contribute just a little to the death count? Perhaps there is a very long tail that would result in the above claimed distribution of 5% causing 100% of deaths? Let’s examine more closely.
 I did some calculating and found that the top 5% of VAX LOTs for each manufacturer indeed account for a percentage of total deaths, but certainly not 100%. Let’s play the game fill in the blank of the headline, shall we?Percentage of COVID-19-related adverse events caused by 5% of the batches:
- Pfizer: 12%
- Moderna: 24%
- Janssen: 14%
Percentage of COVID-19-related deaths caused by 5% of the batches:
- Pfizer: 16%
- Moderna: 20%
- Janssen: 15%
The top 5% of VAX LOTs associated with deaths as per Pfizer, Moderna and Janssen manufacturers do not represent 100% of deaths. The reason it might have appeared that just 5% of the batches were causing 100% of deaths was based on erroneous counting of the dud VAX LOTs which comprise a large percentage of the VAX LOT fields – the so-called tail of 1s. I am in the process of officially cleaning up the VAX LOT data to calculate this percentage precisely, but in the meantime, I am leaving a plot of the long tail and an guesstimate of 95% duds in the VAX LOT column. Seriously, it’s that bad.
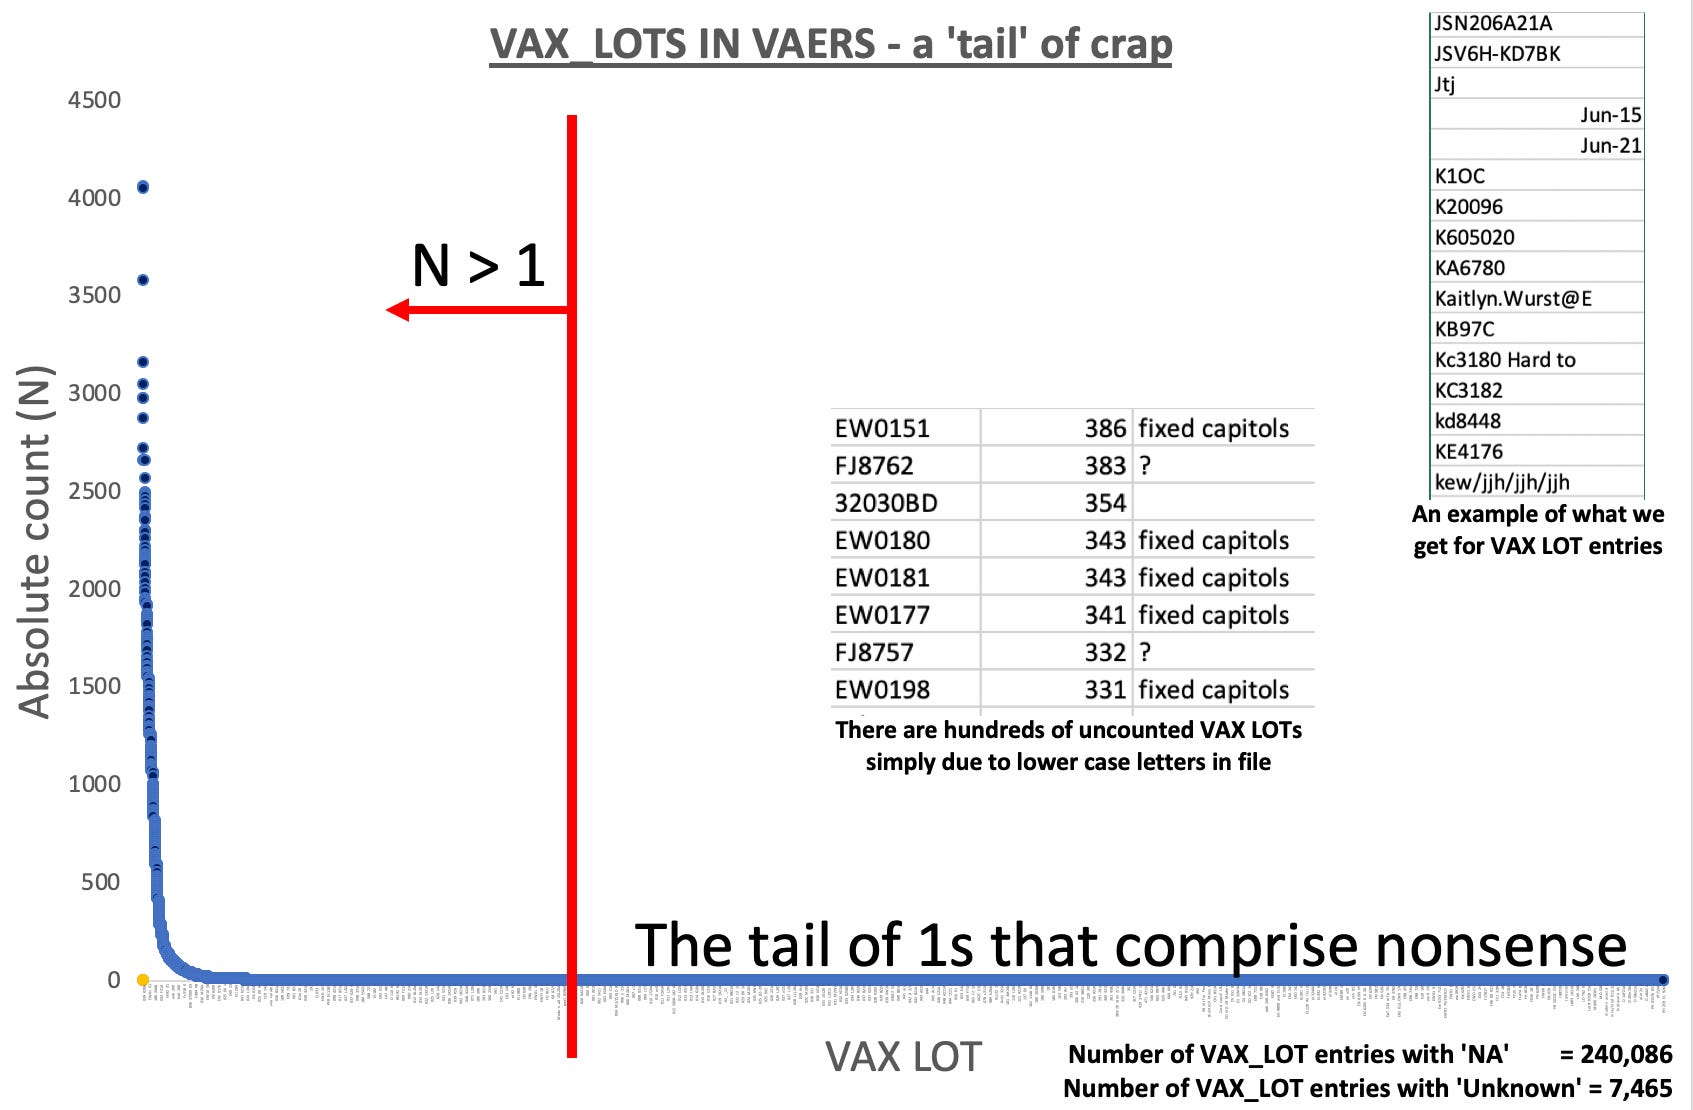 Yes. It IS that bad. As an example, there are hundreds of missed VAX LOTs not counted due to the fact that if they simply have 1 alphanumeric value in lowercase form, they are not counted appropriately. Hundreds of missed data points can switch non-significance to significance and vice-versa. If an “O” is in the place of a ‘0’: not counted. Space between letters and numbers: not counted. Number sign in front of number: not counted. So this seems a simple feat to fix right? It’s not. By the way, as an aside, there are also hundreds of cases when the manufacturer is listed as Moderna but a Pfizer VAX LOT is written in there. The three manufacturers have distinct nomenclatures so it’s easy to tell when they’re mixed up. To fix this, will take time. If I decide to put myself through the hellish exercise. As I have been saying for a year now, the VAX LOT data in VAERS is lamentable and not really useful for backing up big claims. It might be useful for verifyingclaims as the data rolls and gets cleaned up, but for now, I wouldn’t rely on the VAX LOT data from VAERS as the basis of a serious claim. We must be very solid in our claims, if you ask me.Take a look again at these very pretty pie charts showing the proportions/percentages of deaths associated with each VAX LOT per manufacturer of COVID-19 injectable products. First is Pfizer, then Moderna and Janseen. These are the same as in the figure above but bigger so we can see them better.
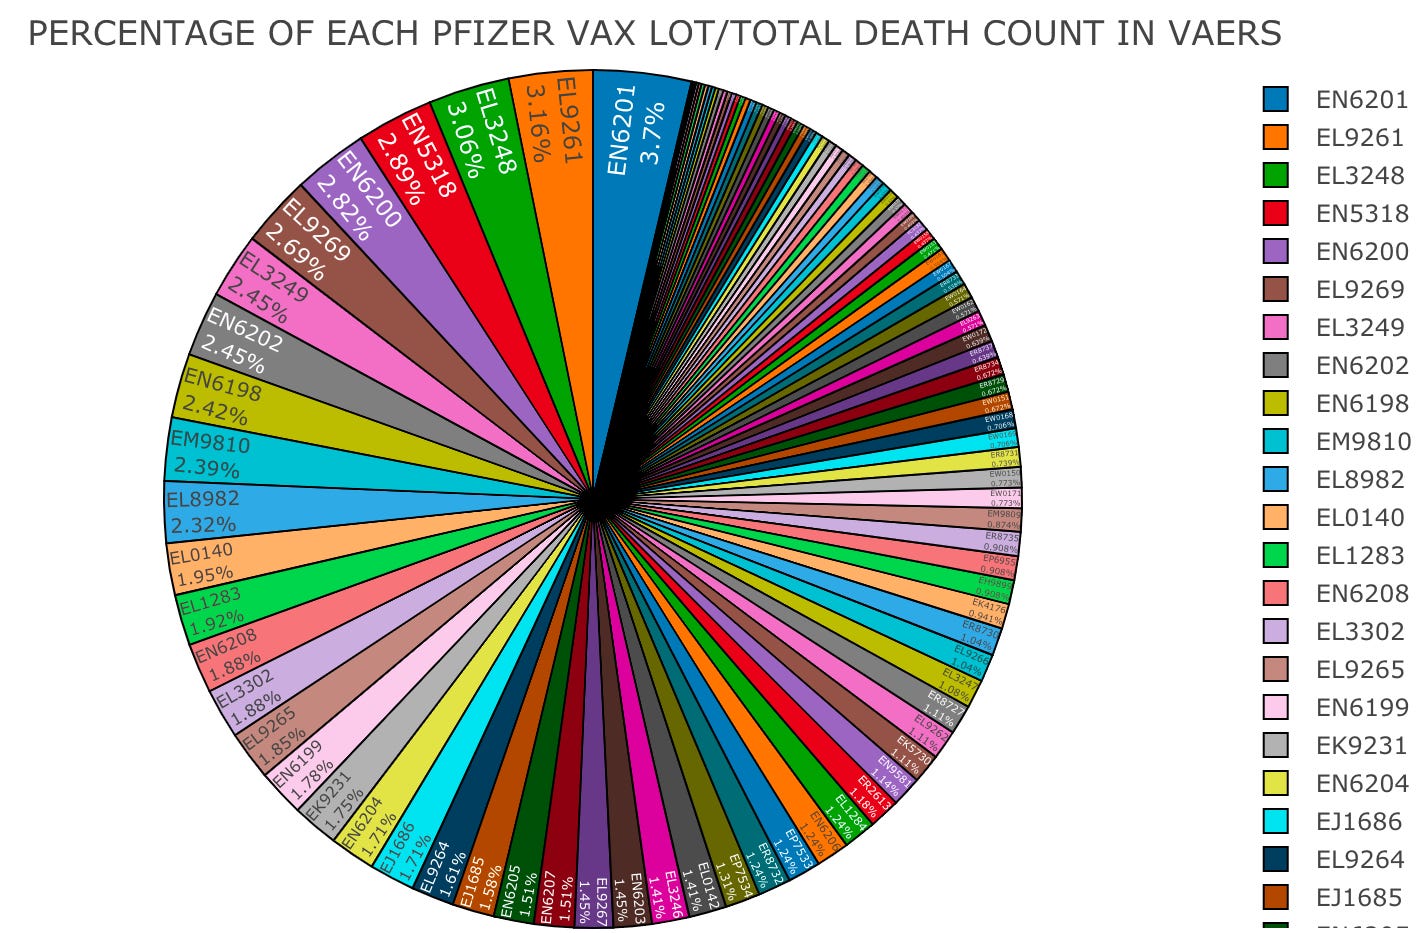
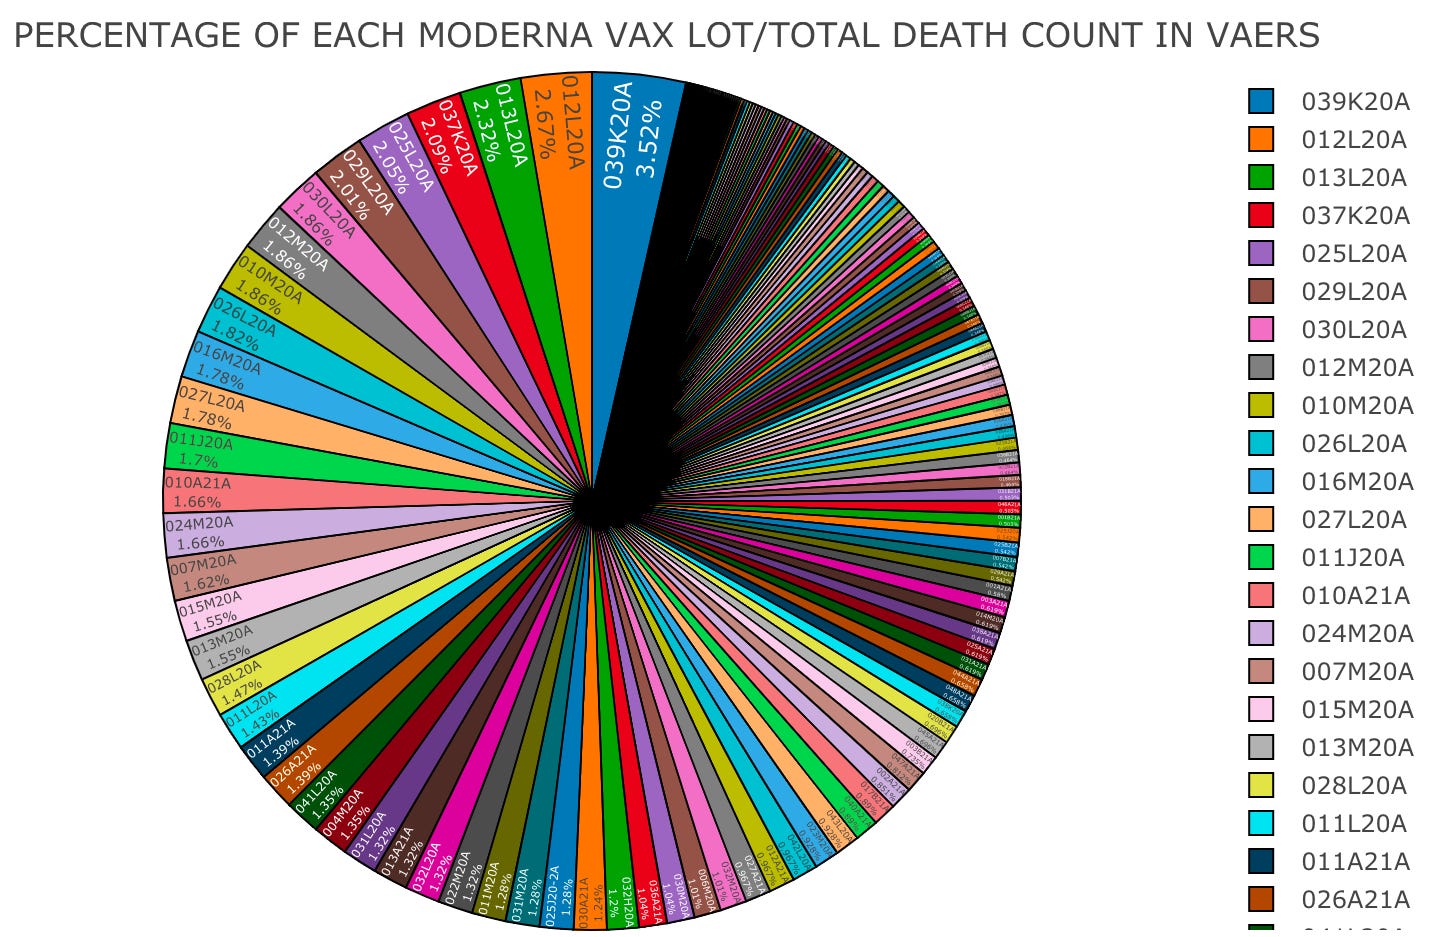
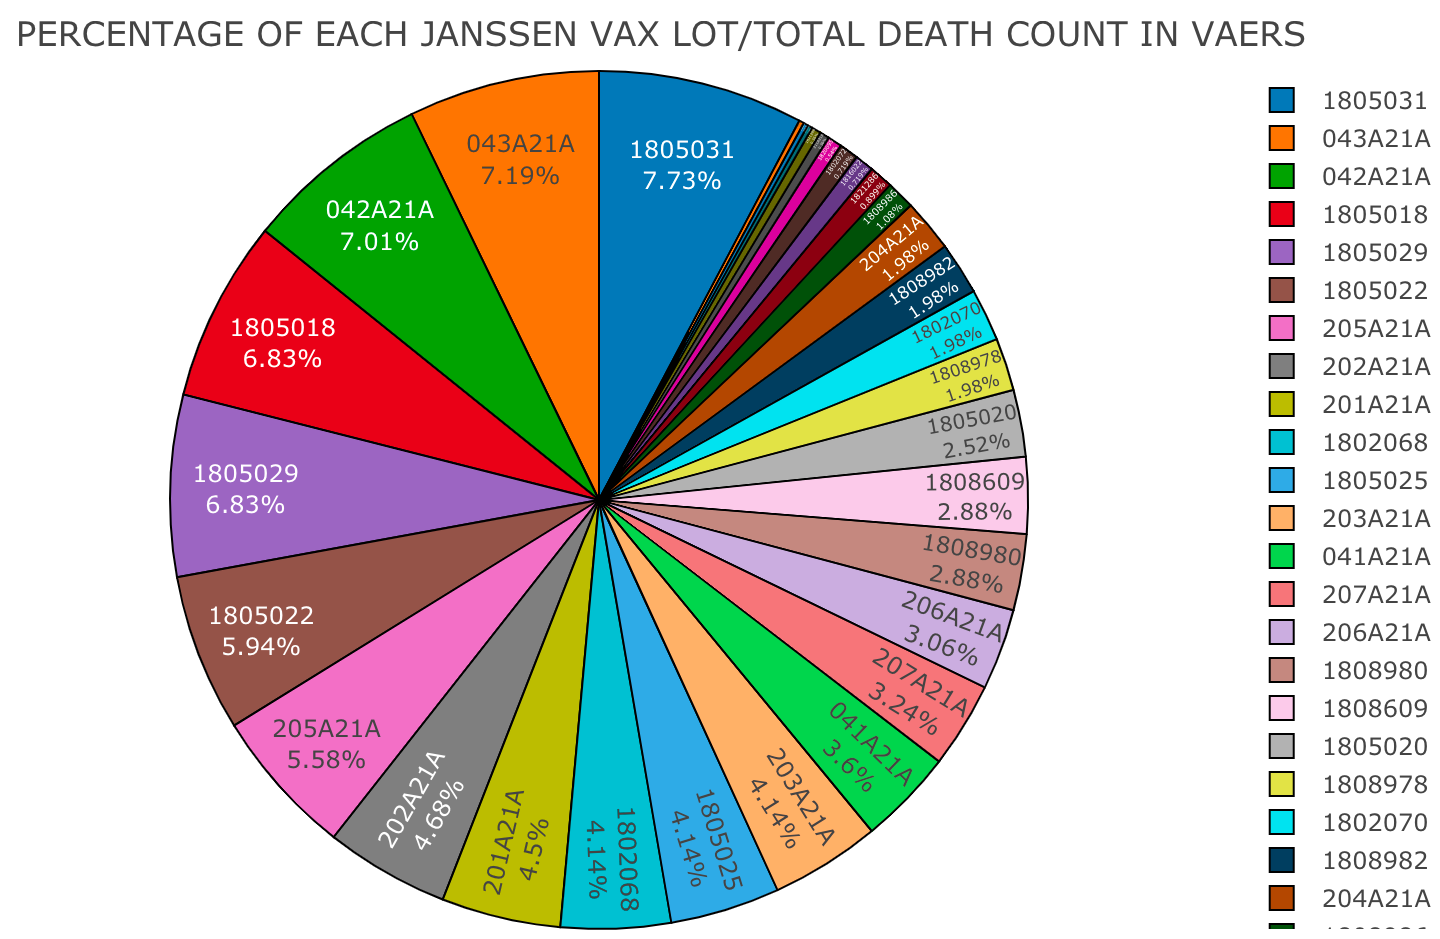 The distribution and thus contribution of each VAX LOT to the death count is quite uniform by eye and is actually also quite uniform in reality as confirmed by my calculations. Certainly, there are VAX LOTs that contribute more to the deaths and other adverse events, granted, but their contribution to the death toll are not substantially higher when compared to their ‘brother’ and ‘sister’ lots in the top 5%. For example, Pfizer’s VAX LOT EN6201 is associated with 3.7% of the deaths which is comparable to the next two largest contributors EL9262 (3.16%) and EL3248 (3.06%). Moderna’s VAX LOT 039K20A is associated with 3.2% of the deaths which actually is a bit different from the next highest contributor 012L20A (2.67%) and Janssen’s VAX LOT 1805031 is associated with 7.73% of the deaths which is pretty similar to the next highest contributor 043A21A (7.19%). But again, the top 5% do not contribute to even close to 100% of all of the deaths. That’s the take home message.
On the subject of Manufacturing and Expiration date data
What is interesting upon examination of the manufacturing and expiration date data are the differences between the viability time frames for each manufacturer. The duration of expiration for their products are not so different – somewhere between ~6-10 months – but Moderna doesn’t have any two that expire on the same day – which makes more sense to me from a production point of view. Why would batches of product made by Pfizer that were made on different days have the same expiration dates? Shouldn’t that viability time frame be equal between VAX LOT production? Even batches of VAX LOTs made on almost the same day should have different expiration dates? Shouldn’t they? Let’s look at the adverse events associated with each manufacturer where the manufacturing date is plotted against the expiration date (below). The size of the labels in the figure below represent the number (N) of adverse events associated with each VAX LOT, and the shading in the data points as well – larger points means higher N.
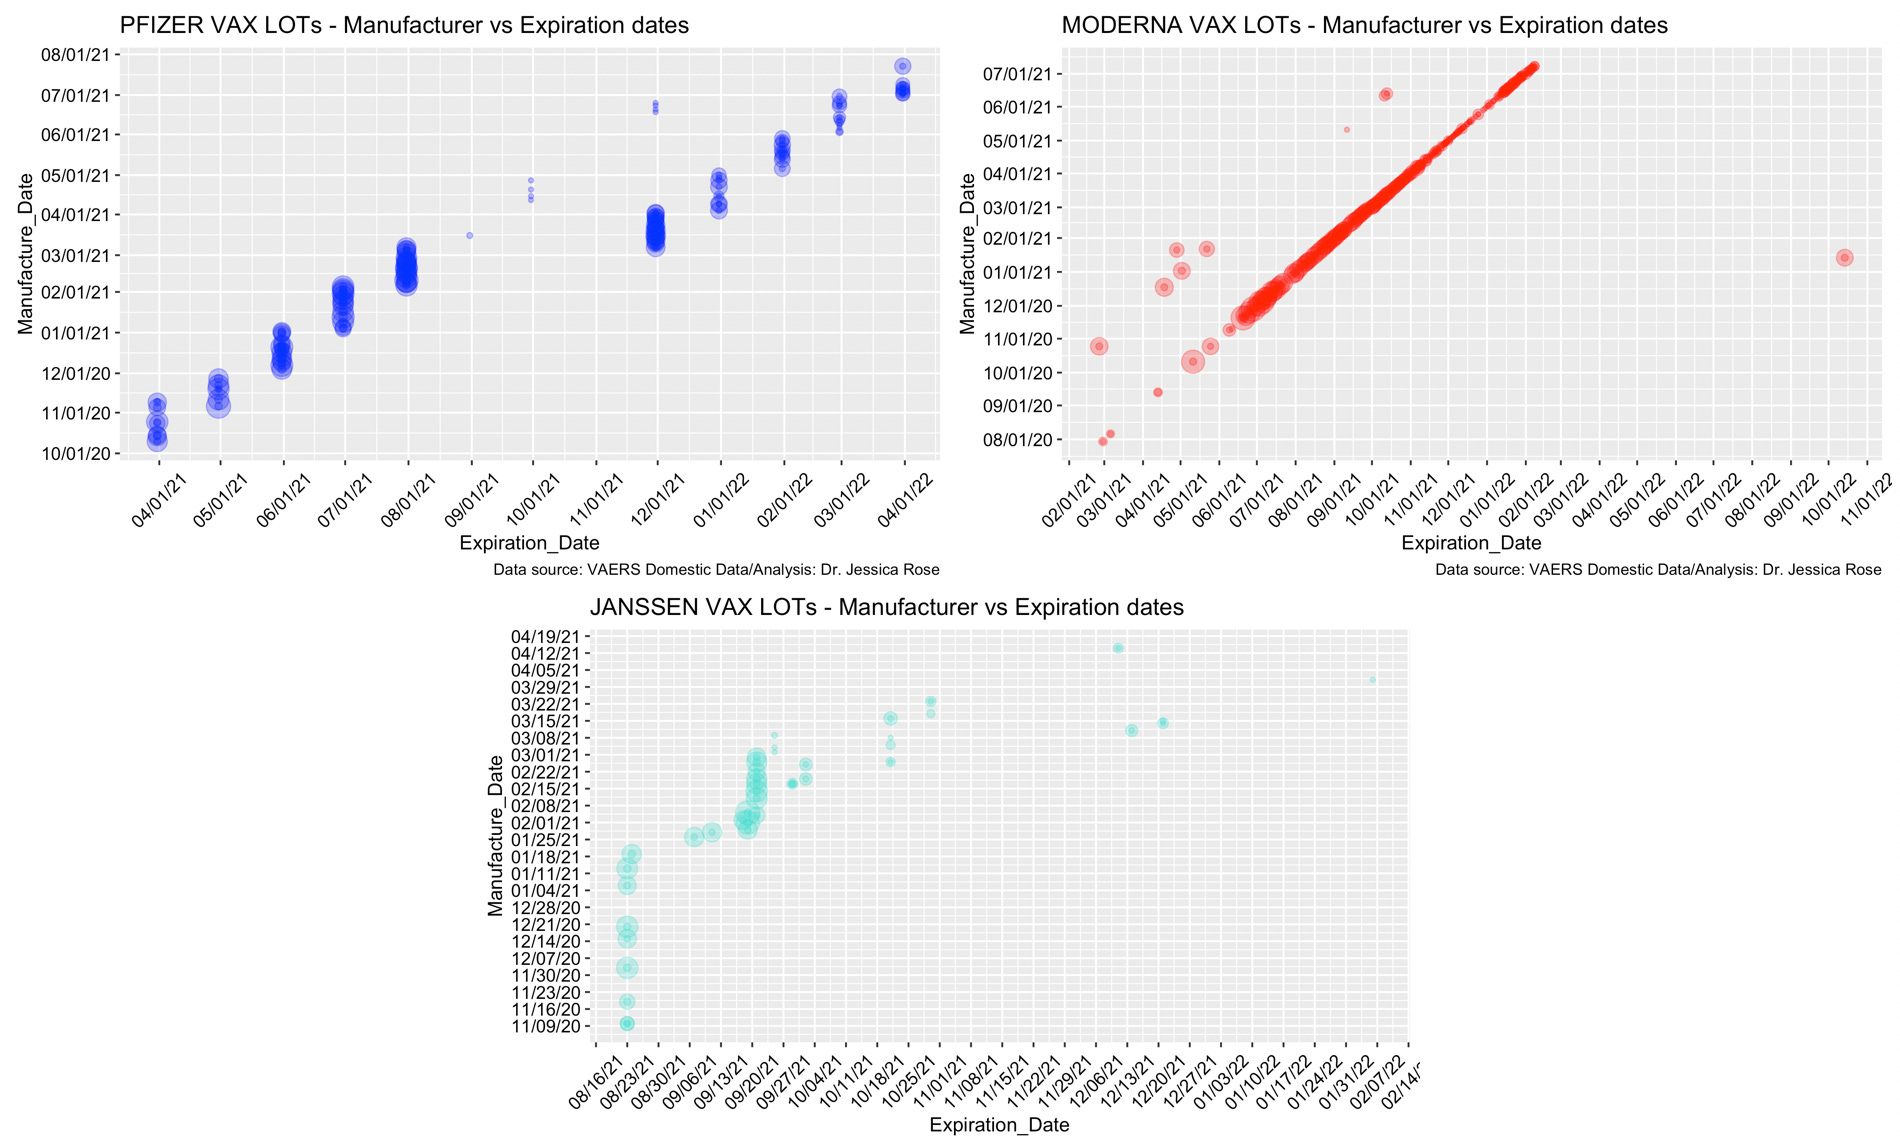 There are three patterns that emerge from the manufacturing versus expiration date data for the three manufacturers Pfizer, Moderna and Janssen. They are different, but the same, actually. In the case of Pfizer, there are lots made between October and November 2020 that all expire in April 2021. That’s cool. Similarly for subsequent batches, we have a bunch of lots made around the same time with the same expiration dates where the time frame for use is approximately half a year (up to ~9 months) until expiration. Moderna is very consistent with maintaining equal viability time frames (~7 months) between manufacturing and expiration dates for almost all of their VAX LOTs.Pfizer has multiple batches of VAX LOTs that expire on the same day even though they were made on different days. This is a bit odd. Why would the duration of ‘freshness’ or ‘viability’ of the product be different between VAX LOTs?
Janssen is weird as well and shares this ‘different manufacturing date but same expiration date’ phenomena with Moderna. There appear to be 2 main batches that expire on the same dates (~mid August and September) that were all made on different days – batches made from the 9th of November 2020 to the 18th of January 2021 all expire on August 23, 2021 so there’s a 2 month difference in viability there. You get the idea.
The interesting thing here (to me anyway) is that there is variability in the viability time frames for different VAX LOTs for the Pfizer and Janssen products. Does this also imply variability in good manufacturing practices both between and among these products. Perhaps variability is to be expected considering the lots are different. But why and how are they different? Why is there variability within the manufacturer?
Why do some VAX LOT batches have shorter best-before dates than others?
Let’s look at the same plots as above but for only death.
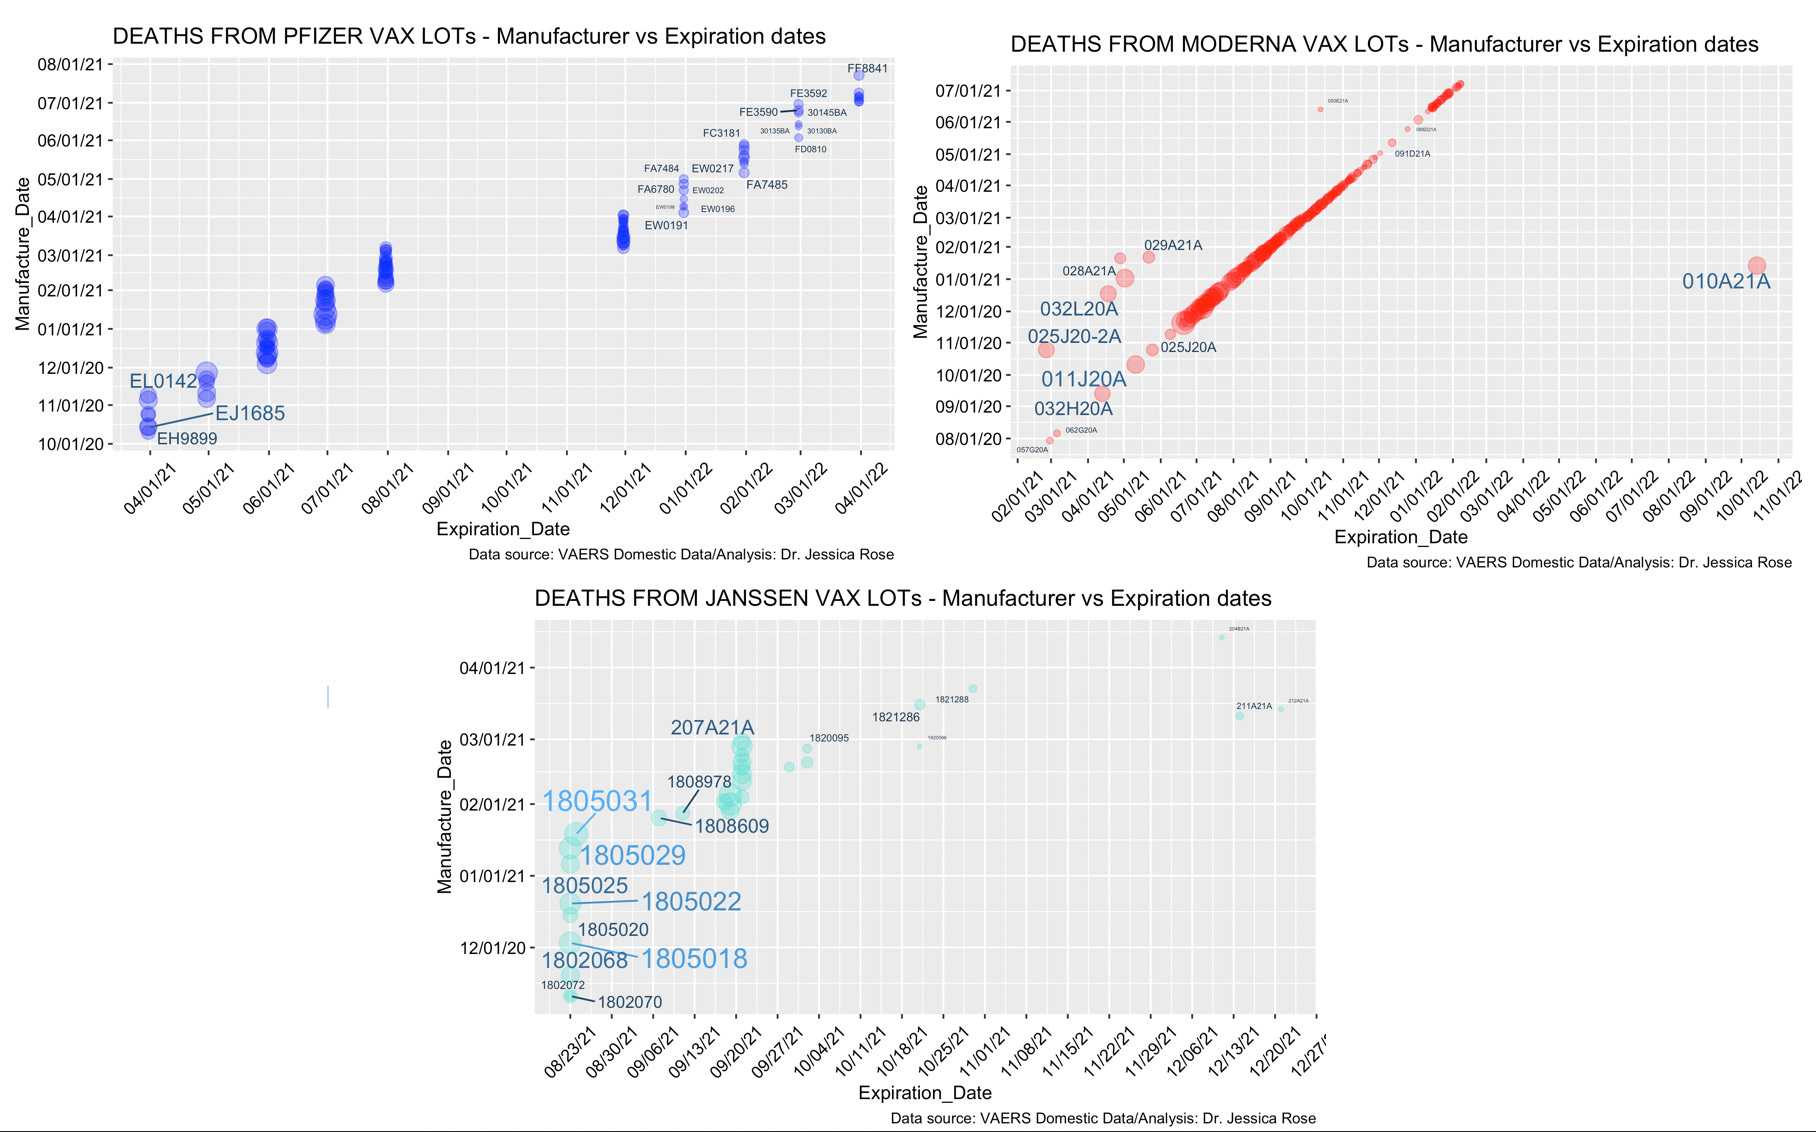 Same patterns and occupation of a lot of point spaces.This is an ongoing work in progress and I am continuing with this analysis while I clean up the VAX LOTs so I hope to post an update soon. Please write down comments as to what you know and/or think about this! I did this in a rushed way and I realize it’s a bit scattered but that’s the joy of Substack – it isn’t a journal submission! I can take my time and make mistakes too!
As per our letter to Rochie and J-bird, I would like to know/have:
1. A definitive list of all Pfizer, Moderna and Janssen VAX LOTs by manufacturer.
- The identity of all the VAX LOTs that have been discarded, are no longer administered or are under investigation.
- How many doses are in each COVID-19 vaccine lot?
4. If vaccine lots contain different numbers of doses, what is the range of doses across all vaccine lots?
5. How many FDA audits have been conducted at each COVID-19 vaccine manufacturing site since the vaccines received Emergency Use Authorization.
- Were all COVID-19 vaccine manufacturing sites found to be in full FDA and Current Good Manufacturing Practice compliance?
7. What specific quality control checks are performed on each vaccine lot?
8. What is the statistical sampling criteria for each quality check on each vaccine lot?
9. What quality control information is provided to your agency by the COVID-19 vaccine manufacturers?
- What do the numbers and alpha characters represent in your lot numbering system?
More specifically: a) Can the manufacturing location be identified by the lot number? How? b) Can the manufacturing date be identified by the lot number? How”? c) What other manufacturing information is captured in the lot number?